Lab Report - Lab 5: Matlab Plotting and Functions
Introduction
The goal of this lab is to utilize matlab to plot functions in various ways. We use the matlab function subplot to make multiple plots in one figure and the plot function with hold on to plot multiple signals on a single plot. This lab serves as a way to introduce more complex plotting methods for future use.
Procedures
1: Write a MATLAB Function
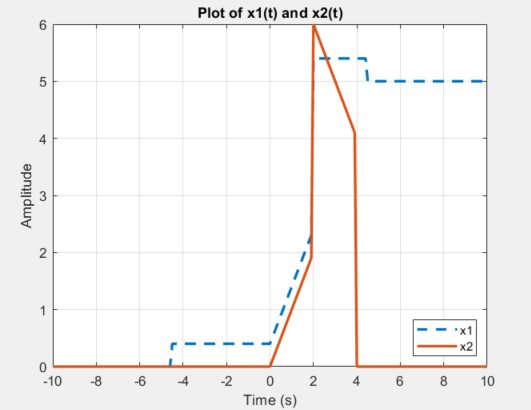
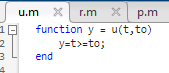 1.1)
1.1)
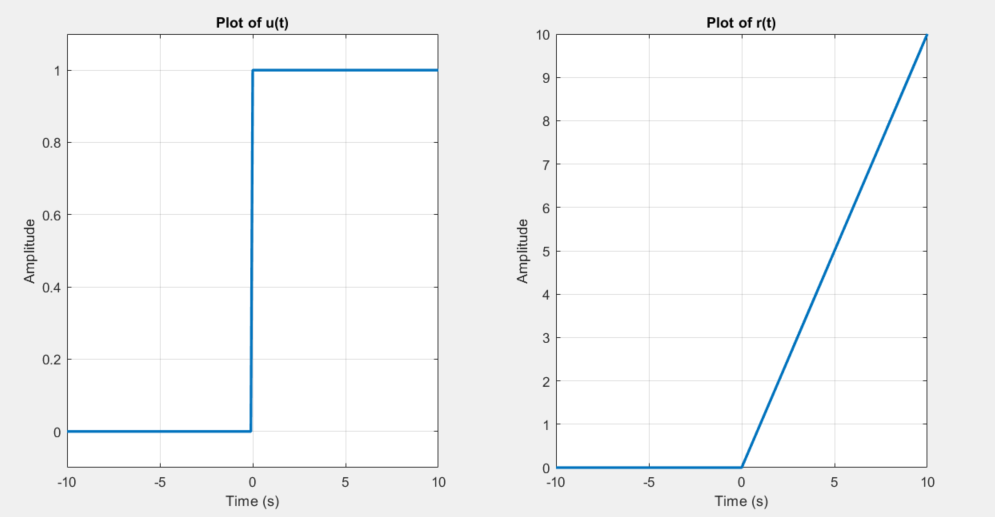
the t = in the command line is setting the range of time that you are
inputing into the plot function.
the plot function is making the graph based on the time set above and
the function. In this case the function is u(t, to) where to is the
offset of the function.
1.2)
When you change the step size of t from .001 to .1 the graph will
simply have more incremnts on the x axis. The graph will look the same
but the x axis will have more points.
1.3)
y=t>=to is telling matlab to only display the graph when t is greater
than your given shift of "to"
2: Ramp Function
 2.1)
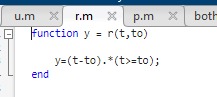
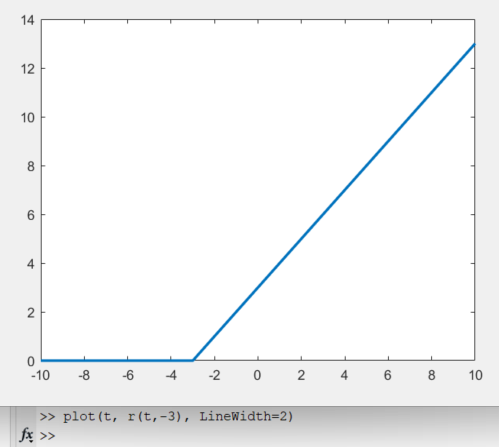
2.1)
y = (t-to).*(t>=to) is telling the matlab code to start applying the
given ramp starting at the given time to.
2.2) below are two plots that show what the ramp will be with differnt
inputs for to. I used -3 and 4
3: Plotting Skills
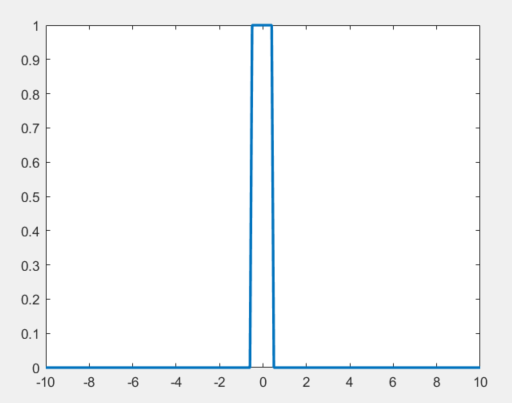
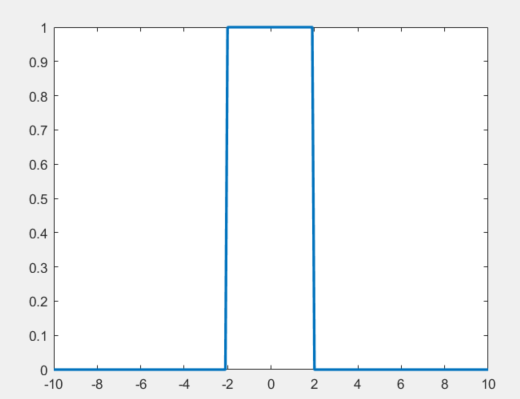
4: Build the Pulse Function
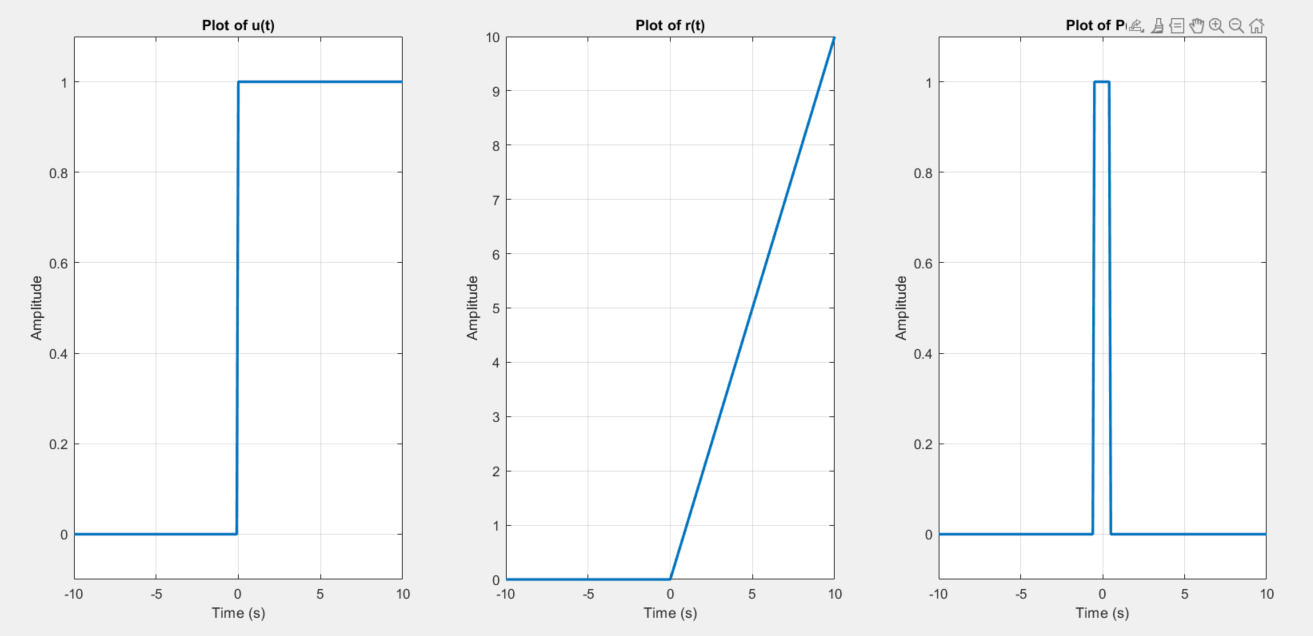
5: Generate a Script with Different Sections
5.1)
The difference between a subplot and using two different figures is
that a subplot is a single figure that fits all the plots into one
window whereas having two figrues will open a seperate window that
contains only the information that is defined within that figures
code.
5.2)
5.3)
Conclusion
What did you enjoy about this lab?
I enjoyed learning how to plot multiple functions on one graph. It was
something I was interested in learning for making scripts for doing
analysis outside of class.
What didn’t go well in this lab?
I had a hard time getting the subplots to work at first as I had to do
soem reading in the docs to figure out how to use them.
How would you improve the lab experiment for future classes?
I would add more complex functions to plot and have the students write
more complex subplots.
Code
Unit Step FunctionRamp Function
Pulse Function
Step 4 Script
Step 5 Script