Lab Report - Lab 4: Special Signals TIMS
Introduction
The goal of this lab is to utilize more TIMS unit modules to produce even more signals. This lab requires measurement of various wave values and the measurement tools that are used to measure these are new to this lab as well. The lab procedure provides steps to making these new signals and utilizing the measurement tools to find the values of these signals. Additionally, the lab shows us how these signals interact with each other under certain conditions.
Procedures
Part A: Digital Pulse Sequence
A.1.5
In the first steps of the lab the procedure introduces the use of a
new module called the Audio Oscillator. This allows the user to
manipulate the frequency of the signal by turning the knob on the
module. In steps A1-5 the lab calls for pluggin in the module and then
adjusting the knob to see the output in picoscope. The screenshot
below shows the output of the signal in picoscope. Additionally, it
shows how to measure places on a signal. The lab procedure asks for
the values of one pulse width and the clock cycle at 1kHz.The results
below were measured
Pulse Width: 518us
Clock Cycle: 998.8us
A.2
Steps 1 - 5 of A.2 ivnlove utilizing the Audio Oscillator with the
tims machine to generate a digital signal to show on the picoscope
 The minimum time Interval of the signal is one of the measurements
required.
The minimum time Interval of the signal is one of the measurements
required.
Minimum Time Interval: .5ms
A.3 - Baseband Channel Filters
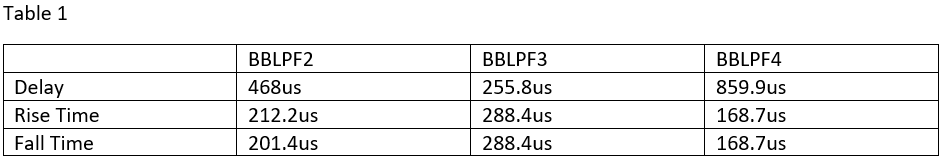
Steps 1 - 5 of A.3 involve using the baseband channel filters to give
a variety of different signals jsut by turnign a know to a certain
setting. The below table (Table 1) shows the different measurements
for each setting of the knob.
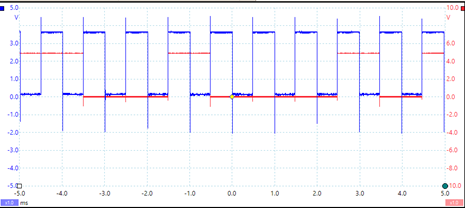
 In steps A.3 6-8 of the procedure, the lab asks us to look at how the
signals don't show a perfect ona nd off when the clock signal is high
to low. As the frequency of the clock increased the correspoinding
signal was no longer able to keep up and rise in time for the clock
signals next pulse. This resulf was achieved when the frequency of the
clock got up to 3.87 kHz. The screenshot below shows the result of the
indistinguishable signal.
In steps A.3 6-8 of the procedure, the lab asks us to look at how the
signals don't show a perfect ona nd off when the clock signal is high
to low. As the frequency of the clock increased the correspoinding
signal was no longer able to keep up and rise in time for the clock
signals next pulse. This resulf was achieved when the frequency of the
clock got up to 3.87 kHz. The screenshot below shows the result of the
indistinguishable signal.
Part B: Step Input
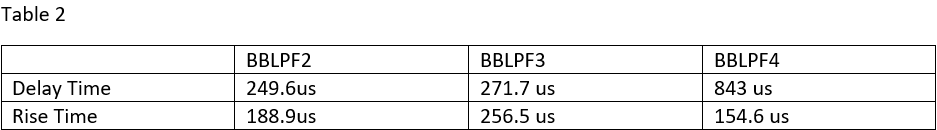
Steps 1 - 4 of the procedure involve utilizign the audio oscillator
and the TIMS unit to make another digital signal where the pulses of
the output aren't perfect and take time to turn on and off. Picoscope
is then used to measure the parts of the signal that are important.
Below is a table (Table 2)showing the results of these
measurements.
Part C: Impulse
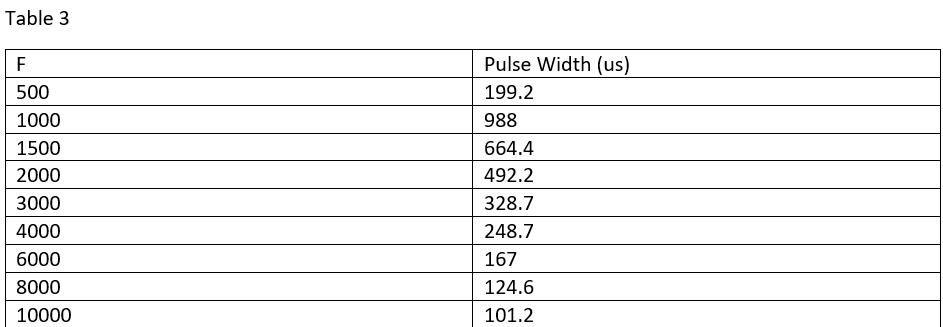
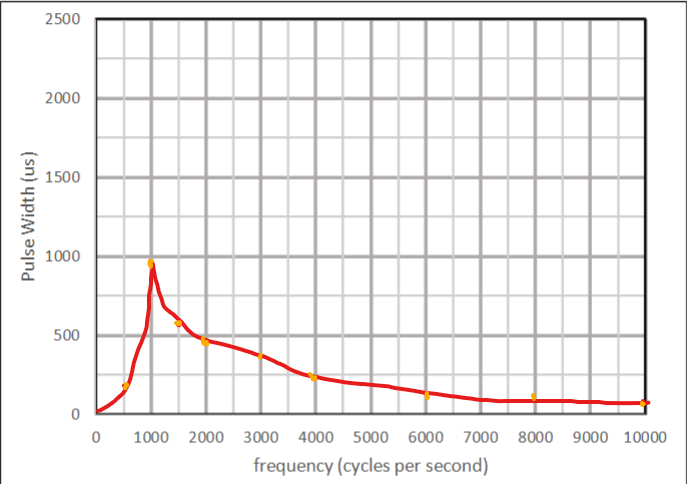
Steps 1 - 4 of part C involve utilizing the sequence generator module
in combination with the audio oscillator to create an impulse signal
to view on picoscope. The below table and graph show the relationship
between frequency and the Pulse Width. THe data was obtained by
turning the knob of the oscillator and measuring on picoscope.
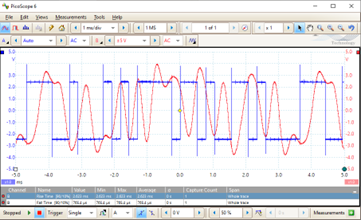
 Steps C 6 - 9 of the procedure involves increasing frequency of the
input signal slowly to see how the amplitude of the output signal
decreases. The amplitude of this output is shrinking because the
cycles are too fast for the
Steps C 6 - 9 of the procedure involves increasing frequency of the
input signal slowly to see how the amplitude of the output signal
decreases. The amplitude of this output is shrinking because the
cycles are too fast for the
Part D: Sinusoidal Signals
D1.1 - Basic Sine Waves
Steps D.1 1 - 7 of the procedure call for using the amplifier module
in tandem with the rest of the modules utilized prior in the lab to
make a signal that displays as one input signal and an amplified
output signal on the picoscope. Below are the results of each filter
at a variety of frequency and their peak to peak voltages.
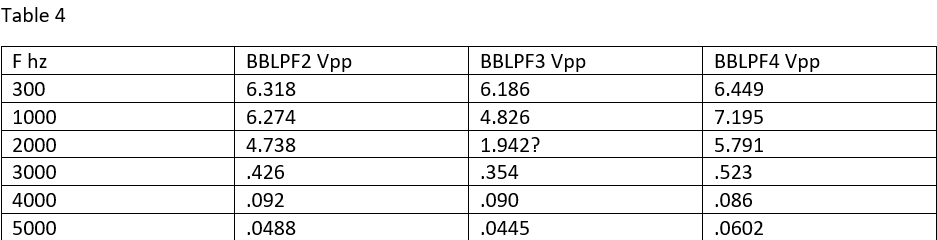 As the frequency increases for each filter mode, the clarity of the
output signal gets worse and worse.
As the frequency increases for each filter mode, the clarity of the
output signal gets worse and worse.
D.2 - Clipping
For D.2 the procedure calls for increasing the amplification using the
amplifier module knob. As the output signal was increasingly
amplified, the signal is distorted intensely. When I brought the
signal slowly to 20 Vpp the output signal hit a limit and would not
increase anymore.
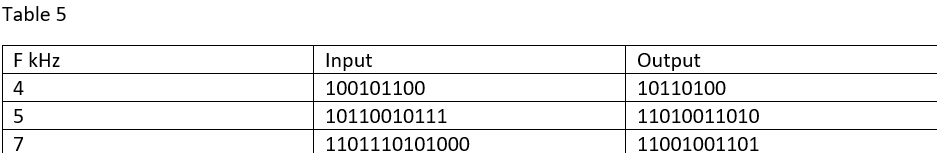
Part E: Digital Detector
The final step of this lab was to setup another signal where the input
and output were displayed on the picoscope. The operations used made
the output signal the inverse of the input clock signal. The next part
of the procedure had the frequency increased to see how the inverse
output gets distorted. Below is a table showing how distortion
effected the binary of the signal.
Conclusion
What did you enjoy about this lab?
I enjoyed the hands on aspect of this lab. I found it interesting to
use so many modules and being able to wire up a bunch of different
signals that were all unique.
What didn't go well in this lab
Something that did not go well was figuring out how to properly
measure the siganls using the picoscope software. After I figured out
the measurement tools I found the rest of the lab to be
straightforward.
How would you improve the lab experiment for the future classes?
Something that could be improved is the clarity of the pictures in the
lab write up. I think they could have indicators as to what part of
the picture the procedure is talking about.